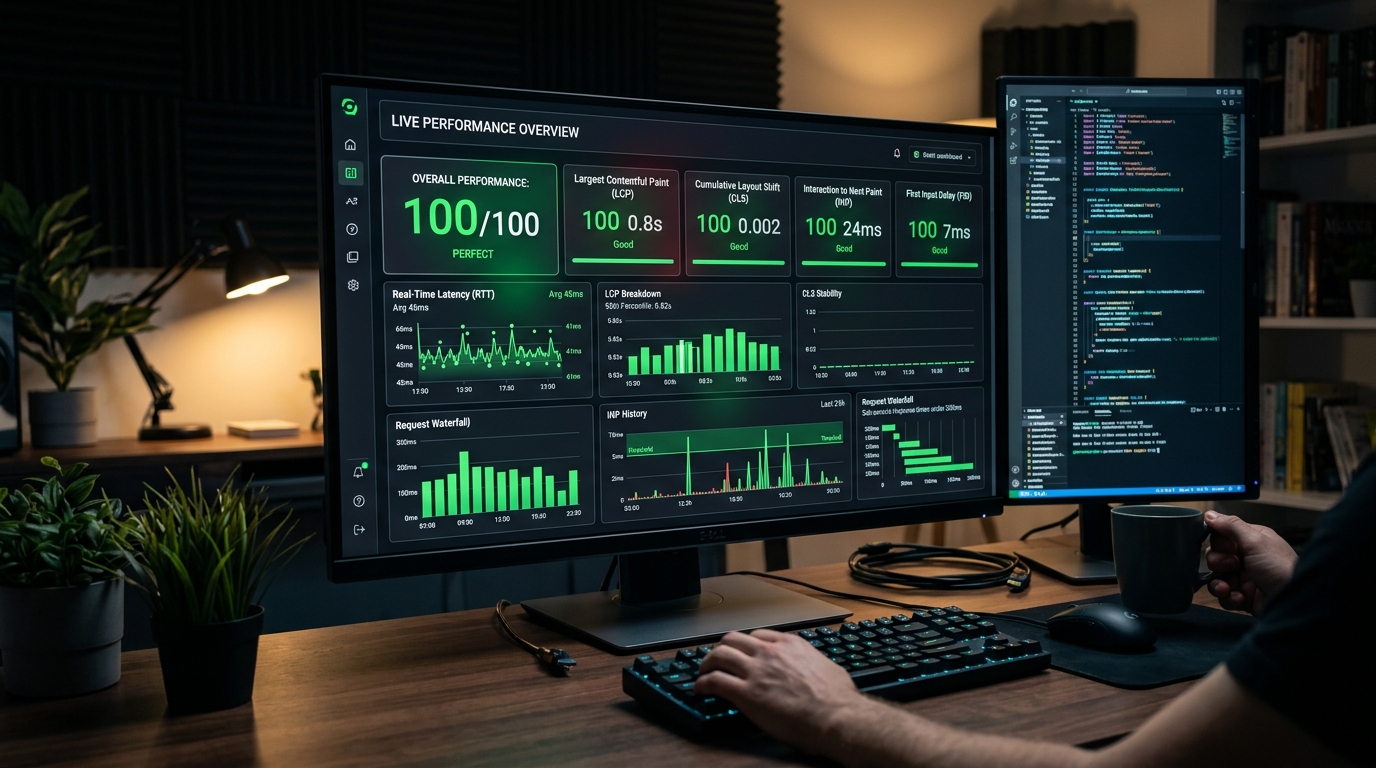
Largest Contentful Paint (LCP) problems are usually a hero image or web font problem, not a JavaScript problem — check your asset pipeline and preload critical media before code-splitting. Google’s own web.dev documentation on Core Web Vitals sets the LCP threshold at 2.5 seconds for a “good” rating, and in practice the single highest-leverage fix is almost always compressing and correctly sizing the largest above-the-fold image, followed by preloading it with a <link rel="preload"> tag rather than letting the browser discover it late in the render tree.
Cumulative Layout Shift (CLS) almost always traces back to images or dynamic banners without reserved aspect-ratio dimensions, or web fonts swapping without matched fallback metrics. Setting explicit width and height attributes (or a CSS aspect-ratio) on every image, and using font-display: optional or matching fallback font metrics, eliminates the majority of layout shift issues we see on handoff review.
Interaction to Next Paint (INP) gets worse with every unnecessary re-render. Profile with Chrome DevTools’ Performance panel before you optimize — guessing which component is slow wastes more time than measuring it. A component that re-renders on every keystroke because of an unmemoized callback is a far more common culprit than “the JavaScript bundle is too big,” even though the second explanation gets blamed more often.
Audit your third-party scripts before you audit your own code. Analytics tags, chat widgets, and ad scripts are frequently the single largest contributor to a slow Time to Interactive, and they are the easiest thing to defer, lazy-load, or move behind a consent gate. We routinely find that removing or deferring two or three third-party scripts improves Core Web Vitals scores more than any first-party code optimization.
Implement edge caching and, where the hosting setup supports it, edge middleware (for example on Cloudflare or Vercel Edge) to reduce Time to First Byte (TTFB) for geographically distributed users. A fast server response is the foundation every other Core Web Vitals metric depends on — no amount of frontend optimization compensates for a slow origin response.
Check your image format and delivery pipeline. Serving AVIF or WebP with a JPEG/PNG fallback, through a CDN with automatic responsive sizing, typically cuts image payload by more than half compared to serving a single large JPEG to every device. Next.js’s built-in Image component handles most of this automatically when configured correctly — verify it is not accidentally disabled or bypassed anywhere in the codebase.
Review your JavaScript bundle for duplicate dependencies before reaching for aggressive code-splitting. It is common to find two versions of the same library (often a UI framework or date-handling library) bundled separately because of a dependency mismatch between packages. A bundle analyzer run should be part of every pre-launch checklist, not just a one-time audit.
Test on real mid-range devices and real network conditions, not just a fast developer laptop on office Wi-Fi. Chrome DevTools’ network and CPU throttling gets you close, but nothing replaces testing on an actual mid-tier Android device on a 4G connection if a meaningful share of your users are on similar hardware.
Re-run Lighthouse or PageSpeed Insights after every meaningful frontend change, not just before launch. Performance regressions are far cheaper to catch and fix immediately after the change that caused them than three sprints later when nobody remembers which deploy introduced the slowdown.
None of these checks replace field data. Lab tools like Lighthouse simulate a single condition; the Chrome User Experience Report (CrUX) and your own Real User Monitoring (RUM) data show what your actual users experience across devices and networks, and should be the final source of truth for whether a page genuinely meets the Core Web Vitals thresholds in production.